We’re looking at another set of scraped data today. This time, over 124,000 LinkedIn job postings over 2023-2024 were scraped by Arsh Koneru and Zoey Yu Zou.
The scrapers retrieved the most recent job postings in relation to the 48-hour period during which their scraping script was run. I think retrieving jobs based on recency provides a fair sample of the jobs on LinkedIn.
The main limitation is then that LinkedIn is not representative of the job market. 53% of LinkedIn users earn more than USD 100,000 a year and 54% of LinkedIn users are university graduates.
Additionally, for many of the analyses below, we have filtered out jobs posted by recruiters and middlemen, since it’s not possible to tell which company of or industry they are from. Postings by recruiters make up 16.4% of the dataset.
Overview by industry
Looking at the five largest industries by number of job postings, we can confirm several things that we already likely know from cultural osmosis: IT is a large and well-compensated industry. Healthcare and Manufacturing, whilst having many new jobs, have middling salaries, on average. There are a large number of poorly-compensated retail jobs.
Financial services have been dethroned by IT as the most “premium” industry – likely because the financialisation and securitisation of everything means that all industries are now over-commodified, not just finance.
With reference to the plot above, IT, Healthcare, Manufacturing, Retail and Financial Services posted 65.6% of all jobs. The lowest salaries, overall, can be found in the Retail and Hospitality industries.
Job categories
Let’s add a column for job categories. Whilst the dataset does already have a column for formatted experience level, this data is lacking for 23% of all postings. I also find LinkedIn’s categories somewhat lacking in definition and not distinctive enough.
So, instead of the six categories (Internship, Entry-level, Associate, Mid-Senior level, Executive and Director) provided by LinkedIn, we now have fifteen. Whilst my categorisation is admittedly imperfect, we have managed to cut down jobs in the “Other” category from 23% to 11%. Further refinement is possible, but there are diminishing returns to wading through that many layers of corporate obfuscation and doublespeak.
A cursory inspection, plotted below, shows that my categorisation has been commonsensical.
Directors, Engineers, Licensed Professionals and Managers earn the most. This lines up with our expectations and we will use these job categories in the later sections when we talk about “good jobs”.
White-collar jobs continue to pay more than blue-collar ones: Technicians, on average, still earn less than Associates and Entry-level jobs.
Middle management jobs are the most commonly posted category on LinkedIn.
The rarest category of jobs are Creatives. But, unlike what your parents told you, they are reasonably compensated. These jobs are just very scarce in comparison to the number of Arts and Communications graduates that exist.
Which industries have the most ‘good jobs’?
IT, Pharmaceuticals and the Legal industry have the highest proportions of good jobs, with more than 50% of jobs posted being for Managers, Licensed Professionals, Engineers and Directors. The industries which are seeking to hire the highest proportions of Licensed Professionals are, unsurprisingly, the Healthcare and Legal industries.
As we will look at later, Pharmaceuticals, Entertainment and Advertising have the highest proportion of director/senior-level postings.
Hospitality and F&B have the highest proportion of low-skilled labourer jobs. And Retail and Natural Resources the lowest proportions of director-level jobs.
Education and Government Administration seem to be dying. And given that this data was scraped before DOGE and the great sack of the American government, these industries likely have an even worse proportion of good jobs now.
Job applications
Let’s take a look next at the breakdown of job applications.
Almost a quarter of job applications in Hospitality and Civil Society were for the limited director-level roles.
Possibly, only more senior candidates in the Hospitality industry use LinkedIn, or that requirements for director-level positions in the Hospitality industry are not as stringent as other industries. Or it could also be due to the Hospitality industry having the second lowest pay amongst all industries, turning people away from the less remunerated positions.
Let’s next take a look at the most oversubscribed and undersubscribed job categories. The plots below show the job categories and industries which have the lowest and highest number of jobs per applicant.
The most oversubscribed job categories are Analysts and Engineers, followed by Creatives. This likely speaks to the glut of coders, programmers and mid-range professionals across all industries, as well as the relatively small number of Creative jobs compared to the people who are interested in them.
The most undersubscribed jobs are Labourers and Officers (across all industries), as well as Licensed Professionals in Healthcare, Wellness and in the Government. As talent and money continue to be funnelled towards IT and Financial Services, there is, perhaps, a lessened desire to pursue more strenuous professional certifications when you can just earn more by coding or engaging in market manipulation.
Most top-heavy industries
The true inequality exists in the gulf between capitalists and workers. But that’s not what LinkedIn is about, though it is a symptom of the disease.
Nevertheless, at the risk of undermining worker solidarity, let us look at how staffing budgets are broken down between different job categories.
In the plot below, we have pro-rated the mean salary per job category per industry by the number of postings.
Advertising, Pharmaceuticals and Biotech and Communications and Events pay out around 25% of salaries of their advertised jobs just to directors. We’ll take a closer look below, since we’re all probably getting Theranos flashbacks.
In Pharmaceuticals, IT and the Legal industry, around 70% of the ‘staff budget’ is dedicated towards Directors, Engineers, Licensed Professionals and Managers.
Taking a closer look at Pharmaceuticals and Advertising, we can see a pattern that I first noticed in Civil Society. In what I have termed Bifurcated Industries or Bifurcated Companies, we see that some of the top-heaviness comes from leadership in these industries needing to govern two or more complex functions.
In the case of Civil Society, you need directors for field operations and fundraising (“development”, as in business development). In Advertising, you need account directors and creative directors. And in Pharmaceuticals, you have research, manufacturing and sales.
Most common management titles in bifurcated industries
Advertising
Pharmaceuticals and Biotech
Civil Society
Director, Marketing Automation & Operations
Senior Director, Transplant Software & Solutions – Strategic Business Segment
Volunteer: Regional Director
Sales Director
Director, Medical Writing
Executive Director
Account Director
Vice President, Safety
Director of Development
Art Director
Associate Director of Global Marketing - Multiple Myeloma
Human Resources Director
Associate Director, Project Management
Associate Director, Biostatistics
Chief Development Officer
Group Account Director
Associate Director, Clinical Trial Oversight
Chief Financial Officer
Associate Creative Director
Associate Director, Statistical Programming
Director of Communications
Associate Creative Director, Copywriter
MSL Director, East
Director of Philanthropy
Associate Media Director
Accounting, Associate Director
Field Director
Chief Marketing Officer
Area Sales Director - IgG4 (Central) - Rare Disease - Amgen
Vice President of Development
Chief Technology Officer
Area Sales Director - IgG4 (Northeast) - Rare Disease - Amgen
Aquatics Director
Director, Client Services
Area Sales Director - IgG4 (Southeast) Rare Disease - Amgen
Chief Executive Officer
Director, Commerce
Area Sales Director - IgG4 (West) Rare Disease - Amgen
Director of Firearm Suicide Prevention Policy, Stoneleigh Fellowship (anywhere in PA)
Director, eCommerce & Retail
Assoc Director/Director, Clinical Operations
Director of Housing
Product Director
Assoc. Director, Strategy and Operations
Director, Next Generation Boards
As to which of these is the core purpose of these companies, from experience, I’d say that revenue generation always wins. And through gradual erosion, the revenue-generating functions will eventually corrupt and override your core purpose.
I would like to go into further detail, but one of the limitations of the dataset is that LinkedIn, as mentioned, is not the entire job market. Additionally, the ratio of CEO pay to worker pay has already been documented by the AFL-CIO.
Perhaps this is an indication that the oligopolistic tendencies of the corporate overclass have long gone unchecked and unquestioned, with hard data hidden behind paywalls, away from the general public.
To add our two cents to the topic, with regards to the plot below which shows the percent of jobs posted by just the top 20 largest companies, all industries show signs of oligopoly and excess concentration. Even at the lower-end of the chart, the top 20 IT companies are responsible for an average of 1% of all job postings each. This is a pretty clear sign of overconcentration, even if you ignore the Magnificent Seven’s stranglehold on patents and market capitalisation.
Unsurprisingly, some of the most consolidated industries also have the largest barriers to entry: Security often requires government contacts, weapons and the murder of indigenous groups and minorities; Telecoms and utilities require massive investment in infrastructure; and Hospitality requires land plots in convenient locations for hotels.
But we also see excess consolidation where the barriers to entry are lower: food manufacturing can often occur at a smaller scale. Opening a gym or spa requires a much lower level of investment than opening a hotel. Yet F&B and Wellness are also extremely consolidated, with around 50% of jobs being posted by just 20 companies.
Percent of LinkedIn postings by the five largest hirers per industry
Industry
Company
% of jobs posted
Security
DNV
18.54
Security
Securitas Security Services USA, Inc.
17.01
Security
GardaWorld
5.45
Security
Federal Bureau of Prisons - Career Connections
3.38
Security
U.S. Army MWR
2.73
Telecoms and Utilities
Cogent Communications
22.75
Telecoms and Utilities
Spectrum
7.70
Telecoms and Utilities
Comcast
4.97
Telecoms and Utilities
Lumen Technologies
2.82
Telecoms and Utilities
AT&T
2.63
Hospitality and Travel
Aimbridge Hospitality
12.40
Hospitality and Travel
Hyatt Hotels Corporation
5.24
Hospitality and Travel
Vacasa
4.18
Hospitality and Travel
Hyatt Regency
4.08
Hospitality and Travel
Sonesta Hotels
3.03
F&B
PepsiCo
7.24
F&B
Barcadia Bar & Grill
5.29
F&B
Raising Cane's Chicken Fingers
5.10
F&B
Sysco
4.57
F&B
Performance Foodservice
4.52
Wellness
Life Time Inc.
10.06
Wellness
ATI Physical Therapy
5.47
Wellness
Ageility
3.85
Wellness
PedIM Healthcare
3.70
Wellness
AltaMed Health Services
3.25
Oligopolies create significant inefficiencies, at the expense of the consumer. This was proven by Bruno Pellegrino in his new model, which confirms that the US economy has not only become more oligopolised but also more inefficient, to the detriment of the consumer. The chart below shows that deadweight loss (loss due to economic inefficiency) due to oligopolies has increased substantially over the past two decades:
Pellegrino’s model also indicates that higher levels of concentration lead to higher markups, meaning that, as he puts it, “The consumer is losing twice”. Once from higher markups and again from greater deadweight loss.
So, what does this mean for you and me? We have to vote for politicians who are committed to trustbusting, forcing oligopolies to separate and limiting the mobility of capital. Failure to do so, will make warnings about mergers and acquisitions made by Liz Lemon all the more prescient: “What if my favourite brand of spicy chips also sold diarrhoea medication?” We’re now at the stage of Malboro making asthma inhalers.
If only it were just pulling the ladder up behind you.
Appendices
A note on Enshittification
A parallel problem to the oligopolisation of the job marketplace is the enshittification of work and work outputs.
If financialisation is the the increasing role of financial motives, markets, actors and institutions, resulting in “financial intermediaries and technologies [gaining] an unprecedented influence over our lives”, then enshittification is process by which AIs and algorithms, perverse indicators, gamification, and over-optimisation (corner cutting) have reduced and cheapened our lives, resulting in a greater and greater divorce from an increasingly bleak reality.
From the plot below, we see that the industries that are the most digitised (after IT) are, unsurprisingly, Business Consulting, Financial Services, Telecoms and Utilities and Insurance. These are all highly financialised sectors that are known to be at the forefront of change (management) and cross-industry fads. It is commonsensical that they would be the most fervent adopters of AI and Machine Learning.
However, the Entertainment and Advertising industries are also highly “optimised” and engineered, a portent, perhaps, of the incoming wave of AI-generated content.
The least tech-forward industry, at least according to new jobs posted, is Hospitality, followed by Retail and F&B. They are the most grounded in the real world. Their enshittification primarily occurs outside of these industries themselves, with middlemen like Trip.com, Agoda, Uber and Doordash undertaking the over-optimisation process on their behalf.
Salaries by industry and job category
Unskilled labour pays the best in Telecoms and Utilities and Natural Resources. Strangely, in Education, Associates are paid slightly more than Teachers (who have been classed as Officers), likely contributing to the shortage of qualified teachers.
Directors in Education and Civil Society are most lowly-paid out of all industries.
Source Code
---title: "Linkedin postings"subtitle: "Part one"author: "Sean Ng"organization: "AIMdata"date-modified: "26 January 2026"execute: echo: false---```{r setup, include = FALSE}knitr::opts_chunk$set(echo = FALSE, warning = FALSE, message = FALSE, fig.width = 9, fig.height = 6)library(tidyverse)library(here)library(janitor)library(scales)library(widyr)library(ggraph)library(patchwork)library(kableExtra)library(viridis)library(DT)library(skimr)library(jsonlite)library(jsonld)`%out%` <- Negate(`%in%`)options(scipen = 100)theme_set(theme_light())range_wna <- function(x){(x-min(x, na.rm = TRUE))/(max(x, na.rm = TRUE)-min(x, na.rm = TRUE))}Mode <- function(x) { ux <- unique(x) ux[which.max(tabulate(match(x, ux)))]}``````{r data}industries <- read_csv("./data/companies/company_industries.csv") |> mutate(industry_simple = case_when( industry %in% c("Staffing and Recruiting", "Human Resources Services") | # This is "A Hiring Company" company_id == 101478385 ~ "Recruiting", industry %in% c("Farming", "Fisheries") ~ "Food Production", industry %in% c("Business Consulting and Services", "Research Services", "Professional Training and Coaching", "Outsourcing and Offshoring Consulting", "Government Relations Services", "Market Research", "Strategic Management Services", "Executive Offices", "Design Services") ~ "Business Consulting", industry %in% c("Public Relations and Communications Services", "Events Services", "Printing Services", "Graphic Design") ~ "Communications and Events", industry %in% c("IT Services and IT Consulting", "Software Development", "Computer and Network Security", "Technology, Information and Internet", "Information Services", "Computer Games", "Computer Networking Products", "Mobile Gaming Apps") ~ "IT", industry %in% c("Financial Services", "Banking", "Venture Capital and Private Equity Principals", "Investment Banking", "Investment Management", "Accounting") ~ "Financial Services", industry %in% c("Construction", "Wholesale Building Materials", "Civil Engineering", "Architecture and Planning") ~ "Construction", industry == "Advertising Services" ~ "Advertising", industry %in% c("Non-profit Organizations", "Civic and Social Organizations", "Religious Institutions", "International Trade and Development", "Political Organizations", "Fundraising", "International Affairs", "Think Tanks", "Philanthropic Fundraising Services", "Public Policy Offices") ~ "Civil Society", industry %in% c("Real Estate", "Facilities Services", "Environmental Services", "Recreational Facilities", "Leasing Non-residential Real Estate") ~ "Real Estate", industry == "Insurance" ~ "Insurance", industry %in% c("Law Practice", "Legal Services", "Administration of Justice", "Alternative Dispute Resolution") ~ "Legal", industry %in% c("Higher Education", "Education Administration Programs", "Primary and Secondary Education", "E-Learning Providers") ~ "Education", industry %in% c("Government Administration", "Legislative Offices", "Individual and Family Services") ~ "Government Administration", industry %in% c("Biotechnology Research", "Pharmaceuticals Manufacturing", "Nanotechnology Research") ~ "Pharmaceuticals and Biotech", industry %in% c("Food and Beverage Services", "Restaurants", "Beverage Manufacturing", "Dairy Product Manufacturing") ~ "F&B", industry %in% c("Mental Health Care", "Hospitals and Health Care", "Medical Practices") ~ "Healthcare", industry %in% c("Medical Equipment Manufacturing", "Industrial Machinery Manufacturing", "Appliances, Electrical, and Electronics Manufacturing", "Food and Beverage Manufacturing", "Pharmaceutical Manufacturing", "Defense and Space Manufacturing", "Chemical Manufacturing", "Motor Vehicle Manufacturing", "Renewable Energy Semiconductor Manufacturing", "Aviation and Aerospace Component Manufacturing", "Automation Machinery Manufacturing", "Packaging and Containers Manufacturing", "Semiconductor Manufacturing", "Personal Care Product Manufacturing", "Computers and Electronics Manufacturing", "Plastics Manufacturing", "Furniture and Home Furnishings Manufacturing", "Paper and Forest Product Manufacturing", "Textile Manufacturing", "Computer Hardware Manufacturing", "Sporting Goods Manufacturing", "Glass, Ceramics and Concrete Manufacturing", "Railroad Equipment Manufacturing", "Shipbuilding", "Tobacco Manufacturing", "Machinery Manufacturing", "Manufacturing") ~ "Manufacturing", industry %in% c("Oil and Gas", "Mining") ~ "Natural Resources", industry %in% c("Utilities", "Telecommunications", "Wireless Services") ~ "Telecoms and Utilities", industry %in% c("Entertainment Providers", "Spectator Sports", "Broadcast Media Production and Distribution", "Media Production", "Book and Periodical Publishing", "Gambling Facilities and Casinos", "Museums, Historical Sites, and Zoos", "Online Audio and Video Media", "Musicians", "Performing Arts", "Translation and Localization", "Newspaper Publishing", "Artists and Writers", "Libraries", "Photography", "Animation and Post-production", "Writing and Editing") ~ "Entertainment", # Tell me it's not true industry %in% c("Airlines and Aviation", "Transportation, Logistics, Supply Chain and Storage", "Freight and Package Transportation", "Maritime Transportation", "Warehousing and Storage", "Truck Transportation") ~ "Transportation and Logistics", industry %in% c("Retail", "Retail Apparel and Fashion", "Consumer Services", "Retail Luxury Goods and Jewelry", # Maybe contentious, but Costco is a retailer "Wholesale", "Retail Office Equipment", "Retail Groceries", "Wholesale Import and Export") ~ "Retail and Sales", industry %in% c("Security and Investigations", "Public Safety", "Law Enforcement", "Armed Forces") ~ "Security", industry %in% c("Travel Arrangements", "Hospitality") ~ "Hospitality and Travel", industry %in% c("Veterinary Services", "Alternative Medicine", "Wellness and Fitness Services") ~ "Wellness" )) |> # Just dropping all the extras group_by(company_id) |> slice_head(n = 1) |> ungroup()job_category_cleaning <- function(tbl){ tbl |> mutate( job_category = case_when( # So that Chief Engineers are still engineers str_detect(title, "Engineer|Developer|Quality Inspector|Quality Control Inspector|Construction Inspector|User Experience Designer|UI/UX Designer") ~ "Engineer", # I think an Account Executive is part of the managerial class str_detect(title, "Manager|MANAGER|Superintendent|Supervisor|Lead|Product Owner|Scrum Master|Cloud Architect|Sous Chef|Human Resources Business Partner|HR Business Partner|Account Executive|Partnership Executive") & !str_detect(title, "Chief") ~ "Manager", str_detect(title, "Partner") & industry_simple == "Legal" ~ "Manager", str_detect(title, "Chief|Director|Business Owner|Co-Founder|Executive|Vice President|Head") & !str_detect(title, "Executive Assistant|Sales Executive|Housekeeper") ~ "Director", str_detect(title, "Trainee|Intern|Paralegal|Entry Level|Support|Teller|ENTRY LEVEL|Accounting Clerk|Graduate Program|Universal Banker|Data Entry Clerk") ~ "Entry Level", str_detect(title, "Associate") & industry_simple == "Legal" ~ "Licensed Professional", str_detect(title, "Attorney|Nurse|Therapist|Dental Hygienist|Architect|Licensed Clinical Social Worker|Physician|Nurse|NURSE|RN|Registered Dietitian|Chemist|Dentist|OCCUPATIONAL THERAPIST|Licensed Mental Health Counselor|Pharmacist|Psychiatrist|Veterinarian|Accountant|Bookkeeper|Auditor|Clinician|Behavior Interventionist|Neurologist|Cardiologist|Optometrist|THERAPIST|Medicine Resident") ~ "Licensed Professional", str_detect(title, "Consultant|Advisor") ~ "Consultant", str_detect(title, "Technician|Detailer|Mechanic|Forklift Operator|Electrician|Machinist|Equipment Operator|Carpenter|Assembler|Operator|Medical Biller|Hair Stylist|Coordinator|Dispatcher| Tech|Plumber") ~ "Technician", str_detect(title, "Officer|Social Worker|Teacher|TEACHER|teacher|Caseworker") & !str_detect(title, "Chief") ~ "Officer", str_detect(title, "Specialist|Technologist|Controller|Phlebotomist|Scientist|Pathologist|Estimator|Data Architect|System Administrator|Systems Administrator|Database Administrator|Planner|Java Architect|Network Administrator|Salesforce Administrator") ~ "Specialist", str_detect(title, "Analyst|Data Modeler") ~ "Analyst", # Not sure about "Buyer" str_detect( title, "Associate|Salesperson|Team Member|Generalist|Merchandiser|Human Resources Business Partner|Buyer|Relationship Banker|salesperson|Retail Parts Pro|ASSOCIATE|Sales Agent|Sales Professional|Sleep Expert - Sales|Representative|REPRESENTATIVE| Rep|Personal Trainer|PROMOTIONS AND SALES POSITIONS|Insurance Agent|Personal Banker|Recruiter|Store Counter Sales|Sales Executive") ~ "Associate", str_detect(title, "Assistant|Receptionist|Retail Sales – Part Time|Front Desk Agent|ASSISTANT|Aide|Office Administrator|Contract Administrator|Legal Secretary|Branch Office Administrator|Payroll Administrator|Inventory Control Clerk|Accounts Payable Clerk") ~ "Assistant", str_detect(title, "Writer|writer|Content Editor|Designer|Copy Editor|Video Editor") ~ "Creative", str_detect(title, "Cook|Driver|Housekeeper|Cashier|Dishwasher|Server|Bartender|Warehouse Worker|Janitor|Groomer|Food Service Worker|Welder|Custodian|Laborer|Dashers|Housekeeping Aide|Barista|In-Store Shopper|Handler|Stocker|Drive with DoorDash|Caregiver|Warehouse Part Time Overnight|Cleaner|Warehouse Part Time Days|Restaurant Delivery|Warehouse Order Selector|Groundskeeper|Keyholder|Porter|Valet|store driver|Concierge|Room Attendant|Attendant|General Labor|Production Worker|Assistant Executive Housekeeper") ~ "Labourer", TRUE ~ "Other" )) |> mutate(senior = ifelse(str_detect(title, "Senior"), "senior", "not senior")) }# path = kagglehub.dataset_download("arshkon/linkedin-job-postings")# https://www.kaggle.com/datasets/arshkon/linkedin-job-postings# The raw dataset is too big for github# But just download it from the link above postings_clean <- read_csv("./raw_data/postings.csv") |> filter(!is.na(company_id)) |> left_join( industries, by = "company_id" ) |> filter(!is.na(industry)) |> filter(!is.na(company_name) & company_name != "Confidential") |> # Likely typos since there's entry-level and associates # Fine to drop them since it's less than 10 entries filter(normalized_salary < 1000000 | is.na(normalized_salary)) |> job_category_cleaning()# postings_clean |> write_csv("./raw_data/postings_clean.csv")```## IntroductionWe're looking at another set of scraped data today. This time, over 124,000 LinkedIn job postings over 2023-2024 were scraped by [Arsh Koneru and Zoey Yu Zou](https://doi.org/10.34740/kaggle/dsv/9200871). The scrapers retrieved the most recent job postings in relation to the 48-hour period during which their scraping script was run. I think retrieving jobs based on recency provides a fair sample of the jobs on LinkedIn. The main limitation is then that LinkedIn is not representative of the job market. [53% of LinkedIn users](https://blog.hootsuite.com/linkedin-demographics/#:~:text=What%20the%20data%20tells%20us,makers%20and%20executive%20audiences%20worldwide.) earn more than USD 100,000 a year and 54% of LinkedIn users are university graduates.Additionally, for many of the analyses below, we have filtered out jobs posted by recruiters and middlemen, since it's not possible to tell which company of or industry they are from. Postings by recruiters make up 16.4% of the dataset. ```{r stats-in-text, eval=FALSE}postings_clean |> filter(industry_simple != "Recruiting") |> mutate(top5 = ifelse(industry_simple %in% c("IT", "Healthcare", "Manufacturing", "Retail and Sales", "Financial Services"), 1, 0)) |> summarise(n = n_distinct(job_id), top5 = sum(top5)) |> mutate(pc = top5 / n)postings_clean |> mutate(is_recruiting = ifelse(industry_simple == "Recruiting", 1, 0)) |> summarise(is_recruiting = sum(is_recruiting), n = n_distinct(job_id)) |> mutate(pc = is_recruiting / n)```<br><br><br>### Overview by industryLooking at the five largest industries by number of job postings, we can confirm several things that we already likely know from cultural osmosis: IT is a large and well-compensated industry. Healthcare and Manufacturing, whilst having many new jobs, have middling salaries, on average. There are a large number of poorly-compensated retail jobs. Financial services have been dethroned by IT as the most "premium" industry -- likely because the financialisation and securitisation of everything means that all industries are now over-commodified, not just finance. <br>```{r summary-plots, fig.height=6}summary_stats <- postings_clean |> filter(industry_simple != "Recruiting") |> group_by(industry_simple) |> summarise(postings = n_distinct(job_id), companies = n_distinct(company_id), salary = mean(normalized_salary, na.rm = TRUE)) summary_stats |> ggplot(aes(x = salary, y = fct_reorder(industry_simple, salary))) + geom_col(aes(fill = salary)) + labs(x = "Mean salary (USD)", y = "", title = "Mean annual salary by industry", subtitle = "Excludes postings by recruiters", fill = "Mean salary") + scale_fill_viridis(option = "plasma", direction = -1, begin = .3, labels = number_format(scale = .001, suffix = "k")) + scale_x_continuous(labels = comma) + theme(legend.position = "bottom") +summary_stats |> ggplot(aes(x = postings, y = fct_reorder(industry_simple, salary))) + geom_col(aes(fill = companies)) + scale_x_continuous(labels = comma) + scale_fill_viridis(direction = -1, option = "plasma", begin = .3) + labs(title = "Job postings in 2023-2024", subtitle = "Excludes postings by recruiters", y = "", x = "Number of job postings", fill = "Number of\ncompanies", caption = "Source: Arsh Koneru, Zoey Yu Zou and LinkedIn.com") + theme(legend.position = "bottom")```<br>With reference to the plot above, IT, Healthcare, Manufacturing, Retail and Financial Services posted 65.6% of all jobs. The lowest salaries, overall, can be found in the Retail and Hospitality industries. <br><br><br>## Job categoriesLet's add a column for job categories. Whilst the dataset does already have a column for `formatted experience level`, this data is lacking for 23% of all postings. I also find LinkedIn's categories somewhat lacking in definition and not distinctive enough. So, instead of the six categories (Internship, Entry-level, Associate, Mid-Senior level, Executive and Director) provided by LinkedIn, we now have fifteen. Whilst my categorisation is admittedly imperfect, we have managed to cut down jobs in the "Other" category from 23% to 11%. Further refinement is possible, but there are diminishing returns to wading through that many layers of corporate obfuscation and doublespeak. A cursory inspection, plotted below, shows that my categorisation has been commonsensical. Directors, Engineers, Licensed Professionals and Managers earn the most. This lines up with our expectations and we will use these job categories in the later sections when we talk about "good jobs".<br>```{r salary-job-category}postings_clean |> # Not sure this is the right filter # We can play around with it filter(normalized_salary > 1000 | is.na(normalized_salary)) |> group_by(job_category) |> summarise(n = n_distinct(job_id), salary = mean(normalized_salary, na.rm = TRUE)) |> ggplot(aes(x = n, y = fct_reorder(job_category, salary))) + geom_col(aes(fill = salary)) + geom_text(aes(label = comma(salary)), hjust = "inward") + scale_fill_viridis(direction = -1, labels = comma) + scale_x_continuous(labels = comma) + labs(x = "Number of postings", y = "", title = "Mean annual salary (USD) by job category", subtitle = "LinkedIn postings in 2023-2024; mean annual salary at the end of the bar.", fill = "Mean\nSalary", caption = "Source: Arsh Koneru, Zoey Yu Zou and LinkedIn.com")ggsave(here("plots", "mean_salary_job_category.png"), width = 8, height = 5, units = "in", dpi = 300)```<br>White-collar jobs continue to pay more than blue-collar ones: Technicians, on average, still earn less than Associates and Entry-level jobs. Middle management jobs are the most commonly posted category on LinkedIn. The rarest category of jobs are Creatives. But, unlike what your parents told you, they are reasonably compensated. These jobs are just very scarce in comparison to the number of Arts and Communications graduates that exist. <br><br><br>## Which industries have the most 'good jobs'? IT, Pharmaceuticals and the Legal industry have the highest proportions of good jobs, with more than 50% of jobs posted being for Managers, Licensed Professionals, Engineers and Directors. The industries which are seeking to hire the highest proportions of Licensed Professionals are, unsurprisingly, the Healthcare and Legal industries. As we will look at later, Pharmaceuticals, Entertainment and Advertising have the highest proportion of director/senior-level postings. <br>```{r good-jobs}postings_clean |> filter(industry_simple != "Recruiting") |> group_by(job_category, industry_simple) |> summarise(n = n_distinct(job_id), salary = mean(normalized_salary, na.rm = TRUE)) |> group_by(industry_simple) |> mutate(pc = n / sum(n), sort = sum(n[job_category %in% c( "Director", "Engineer", "Licensed Professional", "Manager")]) / sum(n)) |> ungroup() |> mutate(job_category = fct_relevel( job_category, c("Director", "Engineer", "Licensed Professional", "Manager", "Consultant", "Creative", "Analyst", "Other", "Specialist", "Officer", "Associate", "Entry Level", "Technician", "Assistant", "Labourer") )) |> arrange(desc(job_category)) |> ggplot(aes(x = pc, y = fct_reorder(industry_simple, sort), group = job_category)) + geom_col(aes(fill = job_category)) + geom_vline(xintercept = .5, linetype = "longdash", colour = "white", alpha = .4) + geom_vline(xintercept = .75, linetype = "longdash", colour = "white", alpha = .4) + scale_fill_viridis_d(option = "turbo") + scale_x_continuous(labels = percent) + labs(title = "Breakdown of job postings by industry and job category", subtitle = "Sorted by percentage of 'good jobs'", x = "", y = "", fill = "", caption = "Source: Arsh Koneru, Zoey Yu Zou and LinkedIn.com") + theme(legend.text = element_text(size = 9))ggsave(here("plots", "good_jobs.png"), width = 8, height = 5, units = "in", dpi = 300)```<br>Hospitality and F&B have the highest proportion of low-skilled labourer jobs. And Retail and Natural Resources the lowest proportions of director-level jobs. Education and Government Administration seem to be dying. And given that this data was scraped before DOGE and the great sack of the American government, these industries likely have an even worse proportion of good jobs now. <br><br><br>### Job applicationsLet's take a look next at the breakdown of job applications.Almost a quarter of job applications in Hospitality and Civil Society were for the limited director-level roles. Possibly, only more senior candidates in the Hospitality industry use LinkedIn, or that requirements for director-level positions in the Hospitality industry are not as stringent as other industries. Or it could also be due to the Hospitality industry having the second lowest pay amongst all industries, turning people away from the less remunerated positions. <br>```{r applications}postings_clean |> filter(industry_simple != "Recruiting") |> group_by(job_category, industry_simple) |> summarise(n = n_distinct(job_id), salary = mean(normalized_salary, na.rm = TRUE), applies = sum(applies, na.rm = TRUE)) |> group_by(industry_simple) |> filter(!is.nan(salary)) |> mutate(pc = n / sum(n), pc_applies = applies / sum(applies), sort = sum(applies[job_category %in% c( "Director", "Engineer", "Licensed Professional", "Manager")]) / sum(applies)) |> ungroup() |> mutate(job_category = fct_relevel( job_category, c("Director", "Engineer", "Licensed Professional", "Manager", "Consultant", "Creative", "Analyst", "Other", "Specialist", "Officer", "Associate", "Entry Level", "Technician", "Assistant", "Labourer") )) |> arrange(desc(job_category)) |> ggplot(aes(x = pc_applies, y = fct_reorder(industry_simple, sort), group = job_category)) + geom_col(aes(fill = job_category)) + geom_vline(xintercept = .5, linetype = "longdash", colour = "white", alpha = .4) + geom_vline(xintercept = .75, linetype = "longdash", colour = "white", alpha = .4) + scale_fill_viridis_d(option = "turbo") + scale_x_continuous(labels = percent) + labs(title = "Break down of applicants by job category and industry", subtitle = "Sorted by percentage of applicants who apply for 'good jobs'", x = "", y = "", fill = "", caption = "Source: Arsh Koneru, Zoey Yu Zou and LinkedIn.com") + theme(legend.text = element_text(size = 9))ggsave(here("plots", "applicant_breakdown.png"), width = 8, height = 5, units = "in", dpi = 300)```<br>Let's next take a look at the most oversubscribed and undersubscribed job categories. The plots below show the job categories and industries which have the lowest and highest number of jobs per applicant. The most oversubscribed job categories are Analysts and Engineers, followed by Creatives. This likely speaks to the glut of coders, programmers and mid-range professionals across all industries, as well as the relatively small number of Creative jobs compared to the people who are interested in them. The most undersubscribed jobs are Labourers and Officers (across all industries), as well as Licensed Professionals in Healthcare, Wellness and in the Government. As talent and money continue to be funnelled towards IT and Financial Services, there is, perhaps, a lessened desire to pursue more strenuous professional certifications when you can just earn more by coding or engaging in market manipulation. <br>```{r oversubscribed, fig.width=8}subscription_prep <- function(tbl){ tbl |> filter(industry_simple != "Recruiting") |> group_by(job_category, industry_simple) |> summarise(n = n_distinct(job_id), salary = mean(normalized_salary, na.rm = TRUE), applies = sum(applies, na.rm = TRUE)) |> group_by(industry_simple) |> mutate(postings_pc = n / sum(n), pc_applies = applies / sum(applies)) |> ungroup() |> mutate(subscription = n / applies) |> arrange(subscription) |> filter(applies > 0 & n > 10) %>% # For future reference # {rbind( head(., 15), tail(., 15) )} |> mutate(combined = paste0(industry_simple, " ", job_category))}subscription_plot <- function(tbl) { tbl |> ggplot(aes(x = subscription, y = fct_reorder(combined, -subscription), group = job_category)) + geom_col(aes(fill = job_category)) + scale_fill_manual(values = c( "Director" = "#30123BFF", "Engineer" = "#4147ADFF", "Licensed Professional" = "#4777EFFF", "Manager" = "#39A4FBFF", "Consultant" = "#1BD0D5FF", "Creative" = "#25ECA7FF", "Analyst" = "#62FC6BFF", "Other" = "#A2FC3CFF", "Specialist" = "#D2E935FF", "Officer" = "#F4C73AFF", "Associate" = "#FE9B2DFF", "Entry Level" = "#F46516FF", "Technician" = "#DB3A07FF", "Assistant" = "#B21A01FF", "Labourer" = "#7A0403FF" )) + labs(x = "Number of jobs per applicant", y = "", fill = "") + theme(legend.position = "none", axis.text.y = element_text(size = 8), axis.text.x = element_text(size = 9))}postings_clean |> subscription_prep() |> head(20) |> subscription_plot() + theme(axis.title.y = element_text(size = 8, hjust=-5)) +postings_clean |> subscription_prep() |> tail(20) |> subscription_plot() + plot_annotation(title = "Most oversubscribed and undersubscribed job categories", subtitle = "X-axis shows number of jobs per applicant. Only showing categories with more than 10 postings.", caption = "Source: Arsh Koneru, Zoey Yu Zou and LinkedIn.com") + plot_layout(axis_titles = "collect")ggsave(here("plots", "oversubscribed_undersubscribed.png"), width = 8, height = 5, units = "in", dpi = 300)```<br><br><br>### Most top-heavy industries The true inequality exists in the gulf between capitalists and workers. But that's not what LinkedIn is about, though it is a symptom of the disease. Nevertheless, at the risk of undermining worker solidarity, let us look at how staffing budgets are broken down between different job categories. In the plot below, we have pro-rated the mean salary per job category per industry by the number of postings. Advertising, Pharmaceuticals and Biotech and Communications and Events pay out around 25% of salaries of their advertised jobs just to directors. We'll take a closer look below, since we're all probably getting Theranos flashbacks.In Pharmaceuticals, IT and the Legal industry, around 70% of the 'staff budget' is dedicated towards Directors, Engineers, Licensed Professionals and Managers. <br>```{r top-heavy}postings_clean |> filter(industry_simple != "Recruiting") |> group_by(job_category, industry_simple) |> summarise(n = n_distinct(job_id), salary = mean(normalized_salary, na.rm = TRUE)) |> group_by(industry_simple) |> filter(!is.nan(salary)) |> mutate(pc = n / sum(n), budget = n * salary, pc_budget = budget / sum(budget), sort = sum(budget[job_category %in% c( "Director", "Engineer", "Licensed Professional", "Manager")]) / sum(budget)) |> ungroup() |> mutate(job_category = fct_relevel( job_category, c("Director", "Engineer", "Licensed Professional", "Manager", "Consultant", "Creative", "Analyst", "Other", "Specialist", "Officer", "Associate", "Entry Level", "Technician", "Assistant", "Labourer") )) |> arrange(desc(job_category)) |> ggplot(aes(x = pc_budget, y = fct_reorder(industry_simple, sort), group = job_category)) + geom_col(aes(fill = job_category)) + geom_vline(xintercept = .5, linetype = "longdash", colour = "white", alpha = .4) + geom_vline(xintercept = .75, linetype = "longdash", colour = "white", alpha = .4) + scale_fill_viridis_d(option = "turbo") + scale_x_continuous(labels = percent) + labs(title = "Which industries are top-heavy?", subtitle = "Sorted by percentage of 'staffing budget' consumed by the top-end", x = "", y = "", fill = "") + theme(legend.text = element_text(size = 9))ggsave(here("plots", "top_heavy.png"), width = 8, height = 5, units = "in", dpi = 300)```<br>Taking a closer look at Pharmaceuticals and Advertising, we can see a pattern that I first noticed in Civil Society. In what I have termed Bifurcated Industries or Bifurcated Companies, we see that some of the top-heaviness comes from leadership in these industries needing to govern two or more complex functions. In the case of Civil Society, you need directors for field operations and fundraising ("development", as in business development). In Advertising, you need account directors and creative directors. And in Pharmaceuticals, you have research, manufacturing and sales. <br>```{r kbl-bifurcated-industries}postings_clean |> filter(job_category == "Director" & industry_simple %in% c("Pharmaceuticals and Biotech", "Advertising", "Civil Society")) |> group_by(industry_simple) |> count(title, sort = TRUE) |> group_by(industry_simple2 = industry_simple) |> group_map(~head(.x, 15)) %>% bind_rows() |> select(-n) |> pivot_wider(names_from = "industry_simple", values_from = "title") |> unnest() |> select(Advertising, `Pharmaceuticals and Biotech`, `Civil Society`) |> kable(booktabs = TRUE, caption = "Most common management titles in bifurcated industries") |> kable_classic_2("striped")```<br>As to which of these is the core purpose of these companies, from experience, I'd say that revenue generation always wins. And through gradual erosion, the revenue-generating functions will eventually corrupt and override your core purpose. I would like to go into further detail, but one of the limitations of the dataset is that LinkedIn, as mentioned, is not the entire job market. Additionally, the ratio of CEO pay to worker pay has already been documented by the [AFL-CIO](https://aflcio.org/paywatch/company-pay-ratios). <br><br><br>## Industry consolidation and oligopoliesIf you were to search up "[Herfindahl-Hirschman Index](https://en.wikipedia.org/wiki/Herfindahl%E2%80%93Hirschman_index#:~:text=HHI%20is%20calculated%20by%20squaring,share%2C%20weighted%20by%20market%20share.) by industry", you will find no relevant recent results. Yet corporate mergers and acquisitions continue unabated as the plot below from the [Institute of Mergers, Acquisitions and Alliances](https://imaa-institute.org/mergers-and-acquisitions-statistics/united-states-ma-statistics/) attests to. <br>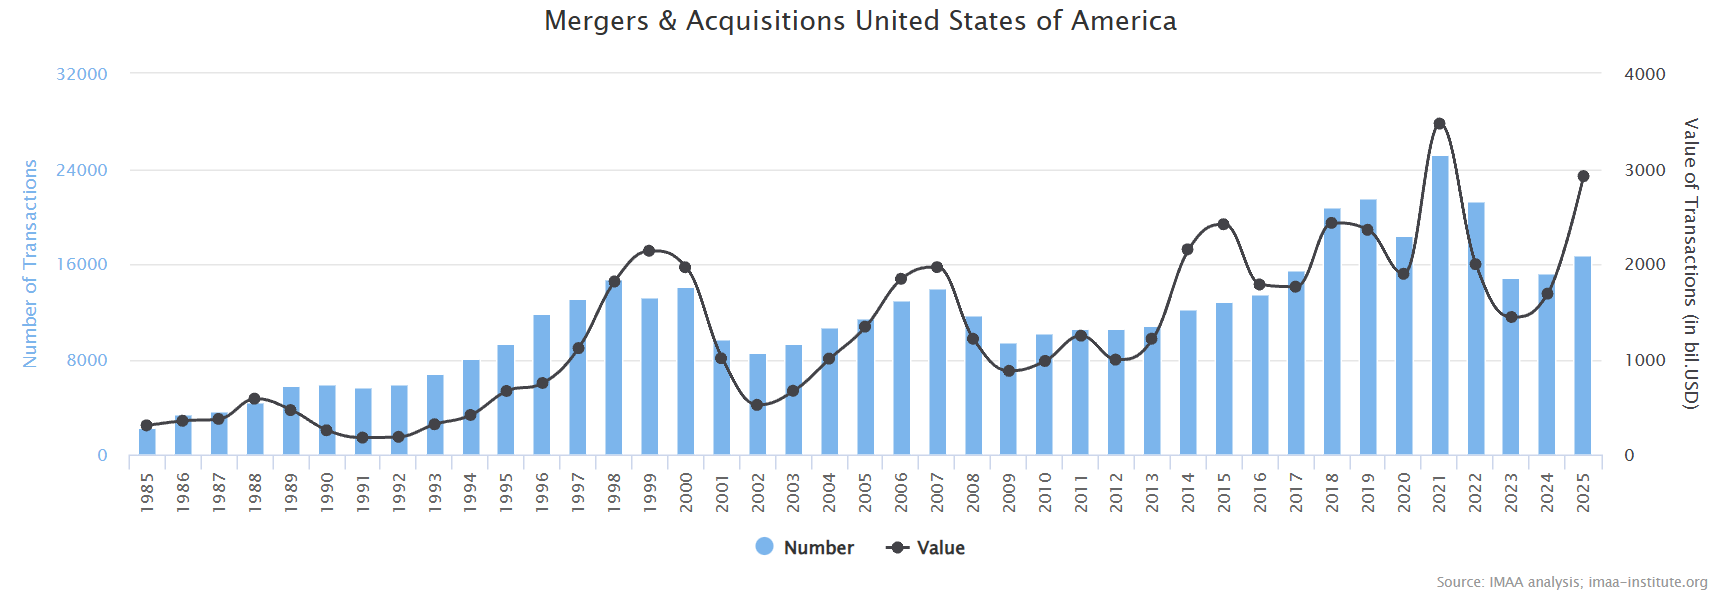<br>Perhaps this is an indication that the oligopolistic tendencies of the corporate overclass have long gone unchecked and unquestioned, with hard data hidden behind paywalls, away from the general public. To add our two cents to the topic, with regards to the plot below which shows the percent of jobs posted by just the top 20 largest companies, all industries show signs of oligopoly and excess concentration. Even at the lower-end of the chart, the top 20 IT companies are responsible for an average of 1% of all job postings each. This is a pretty clear sign of overconcentration, even if you ignore the Magnificent Seven's stranglehold on patents and market capitalisation. <br>```{r consolidation}postings_clean |> filter(industry_simple != "Recruiting" & company_name != "A Hiring Company") |> group_by(industry_simple, company_id) |> summarise(postings = n_distinct(job_id), .groups = "drop") |> group_by(industry_simple) |> mutate(industry_postings = sum(postings), pc = postings / industry_postings) |> filter(industry_postings > 100) |> arrange(desc(pc)) |> slice_head(n = 20) |> group_by(industry_simple) |> summarise(pc = sum(pc)) |> ungroup() |> ggplot(aes(x = pc, y = fct_reorder(industry_simple, pc))) + geom_col(fill = "#e07a5f") + geom_text(aes(label = percent(round(pc, 3))), hjust = "inward") + scale_x_continuous(labels = percent, breaks = seq(0, .8, .1)) + labs(title = "All industries are incredibly consolidated", subtitle = "Percentage of LinkedIn jobs posted by the top 20 companies", x = "", y = "")ggsave(here("plots", "consolidation.png"), width = 8, height = 5, units = "in", dpi = 300) ```<br>Unsurprisingly, some of the most consolidated industries also have the largest barriers to entry: Security often requires government contacts, weapons and the murder of indigenous groups and minorities; Telecoms and utilities require massive investment in infrastructure; and Hospitality requires land plots in convenient locations for hotels. But we also see excess consolidation where the barriers to entry are lower: food manufacturing can often occur at a smaller scale. Opening a gym or spa requires a much lower level of investment than opening a hotel. Yet F&B and Wellness are also extremely consolidated, with around 50% of jobs being posted by just 20 companies.<br>```{r kbl-consolidation}postings_clean |> filter(industry_simple %in% c("Security", "Telecoms and Utilities", "Hospitality and Travel", "F&B", "Wellness")) |> mutate(industry_simple = fct_relevel(industry_simple, c("Security", "Telecoms and Utilities", "Hospitality and Travel", "F&B", "Wellness"))) |> group_by(industry_simple, company_name) |> summarise(postings = n_distinct(job_id), .groups = "drop") |> group_by(industry_simple) |> mutate(industry_postings = sum(postings), percentage = round(postings / industry_postings * 100, 2)) |> arrange(desc(percentage)) |> slice_head(n = 5) |> ungroup() |> select(-postings, -industry_postings) |> rename( Industry = industry_simple, Company = company_name, `% of jobs posted` = percentage ) |> kable(booktabs = TRUE, caption = "Percent of LinkedIn postings by the five largest hirers per industry") |> kable_classic_2("striped", full_width = FALSE) # save_kable("./plots/percent_postings.png")```<br>Oligopolies create significant inefficiencies, at the expense of the consumer. This was proven by [Bruno Pellegrino](https://papers.ssrn.com/sol3/papers.cfm?abstract_id=3329688) in his new model, which confirms that the US economy has not only become more oligopolised but also more inefficient, to the detriment of the consumer. The chart below shows that deadweight loss (loss due to economic inefficiency) due to oligopolies has increased substantially over the past two decades:<br>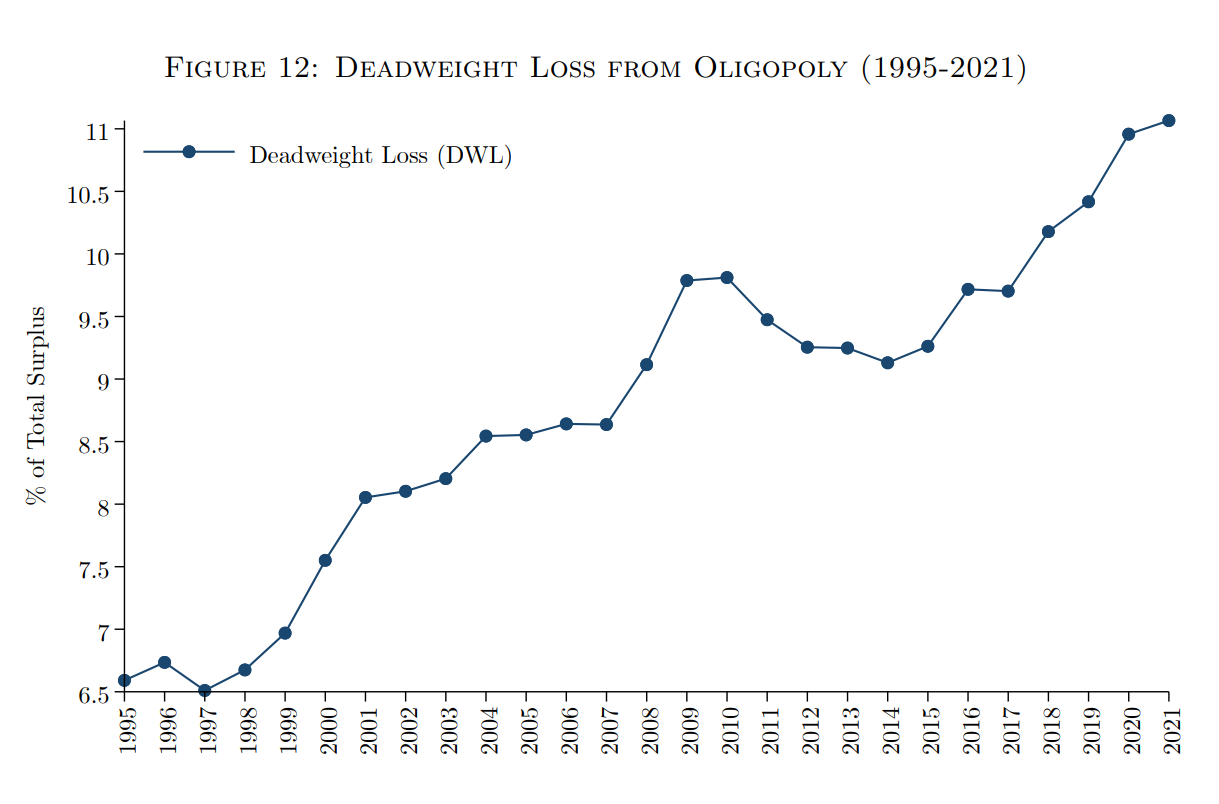<br>Pellegrino's model also indicates that higher levels of concentration lead to higher markups, meaning that, as he [puts it](https://www.promarket.org/2019/09/16/the-cost-of-america-oligopoly-problem/), "The consumer is losing twice". Once from higher markups and again from greater deadweight loss. So, what does this mean for you and me? We have to vote for politicians who are committed to trustbusting, forcing oligopolies to separate and limiting the mobility of capital. Failure to do so, will make warnings about mergers and acquisitions made by [Liz Lemon](https://www.imdb.com/title/tt0496424/) all the more prescient: "What if my favourite brand of spicy chips also sold diarrhoea medication?" We're now at the stage of Malboro making [asthma inhalers](https://onlinelibrary.wiley.com/doi/full/10.1111/resp.14244?trk=public_post_comment-text).If only it were just pulling the ladder up behind you. <br><br><br><br><br><br>## Appendices### A note on Enshittification A parallel problem to the oligopolisation of the job marketplace is the enshittification of work and work outputs. If financialisation is the the [increasing role](https://www.tni.org/en/publication/financialisation-a-primer) of financial motives, markets, actors and institutions, resulting in "financial intermediaries and technologies [gaining] an unprecedented influence over our lives", then enshittification is process by which AIs and algorithms, perverse indicators, gamification, and over-optimisation (corner cutting) have reduced and cheapened our lives, resulting in a greater and greater divorce from an increasingly bleak reality. From the plot below, we see that the industries that are the most digitised (after IT) are, unsurprisingly, Business Consulting, Financial Services, Telecoms and Utilities and Insurance. These are all highly financialised sectors that are known to be at the forefront of change (management) and cross-industry fads. It is commonsensical that they would be the most fervent adopters of AI and Machine Learning. However, the Entertainment and Advertising industries are also highly "optimised" and engineered, a portent, perhaps, of the incoming wave of AI-generated content. <br>```{r enshittification}postings_clean |> filter(industry_simple != "Recruiting") |> mutate(is_it = ifelse( str_detect(title, "Software|Data|Network|UI|DevOps|Full Stack|System|Cloud|Application|Site Reliability|Machine Learning|Cyber|Developer|Java|Security Engineer|Database|Data Architect|Modeler|Datacenter|Data Center|BI|Azure|Databricks|UI|UX|Python|Solution|Dotnet|Online|Product Owner|Scrum|Automation|Oracle|User|Validation|Salesforce|Mule|Desktop|Android|Information Security|Information Technology|Information System|Digital|Digital Adoption|Analyst|Product Manager|iOS|Quality Assurance Engineer|Adoption|Agile|Frontend|Business Analyst|Technical Lead|AI|Artificial Intelligence|Automotive Engineer|Quality Assurance Engineer|Mainframe|ServiceNow|Enterprise Architect|Generative|ML|Experience Designer|Technical Support Specialist|DevSecOps|Test Engineer|IT|SAP|Cobol|Citrix|Intelligence Lead|Kafka|Linux|Rub|Middleware|AWS|Windows") & !str_detect(title, "TRAINING|AIDE|QUAIL|MAINTENANCE|CHAPLAIN|AML|MLT"), 1, 0 )) |> group_by(industry_simple) |> summarise(n = n_distinct(job_id), is_it = sum(is_it)) |> ungroup() |> mutate(pc = is_it / n) |> ggplot(aes(x = pc, y = fct_reorder(industry_simple, pc))) + geom_col(fill = "#f6bd60") + scale_x_continuous(labels = percent) + labs(title = "Percent of jobs in the world of numbers", subtitle = "Jobs with some variation of ML/AI/Data/Full Stack in their titles", x = "", y = "")ggsave(here("plots", "enshittification.png"), width = 8, height = 5, units = "in", dpi = 300) ```<br>The least tech-forward industry, at least according to new jobs posted, is Hospitality, followed by Retail and F&B. They are the most grounded in the real world. Their enshittification primarily occurs outside of these industries themselves, with middlemen like Trip.com, Agoda, Uber and Doordash undertaking the over-optimisation process on their behalf. <br><br><br>### Salaries by industry and job categoryUnskilled labour pays the best in Telecoms and Utilities and Natural Resources. Strangely, in Education, Associates are paid slightly more than Teachers (who have been classed as Officers), likely contributing to the shortage of qualified teachers. <br>```{r low-end}postings_clean |> filter(industry_simple != "Recruiting") |> group_by(job_category, industry_simple) |> summarise(n = n_distinct(job_id), salary = mean(normalized_salary, na.rm = TRUE)) |> filter(job_category %in% c("Officer", "Associate", "Entry Level", "Technician", "Assistant", "Labourer")) |> mutate(job_category = fct_relevel( job_category, c("Officer", "Associate", "Entry Level", "Technician", "Assistant", "Labourer") )) |> arrange(job_category) |> ggplot(aes(x = salary, y = fct_relevel(job_category, c("Labourer", "Assistant", "Technician", "Entry Level", "Associate", "Officer")))) + geom_col(aes(fill = job_category)) + geom_vline(xintercept = .5, linetype = "longdash", colour = "white", alpha = .4) + geom_vline(xintercept = .75, linetype = "longdash", colour = "white", alpha = .4) + scale_fill_manual(values = c( "Officer" = "#F4C73AFF", "Associate" = "#FE9B2DFF", "Entry Level" = "#F46516FF", "Technician" = "#DB3A07FF", "Assistant" = "#B21A01FF", "Labourer" = "#7A0403FF" )) + facet_wrap(~ industry_simple) + scale_x_continuous(labels = number_format(scale = 0.001, suffix = "k")) + labs(x = "Mean annual salary (USD)", y = "", title = "Which industries are the best to start out in?") + theme(strip.background = element_rect(fill = "black"), strip.text = element_text(size = 8.5)) + guides(fill = "none")```<br>```{r mid-range}postings_clean |> filter(industry_simple != "Recruiting") |> group_by(job_category, industry_simple) |> summarise(n = n_distinct(job_id), salary = mean(normalized_salary, na.rm = TRUE)) |> filter(job_category %in% c("Specialist", "Other", "Analyst", "Creative", "Consultant")) |> arrange(job_category) |> ggplot(aes(x = salary, y = fct_relevel(job_category, c("Specialist", "Other", "Analyst", "Creative", "Consultant")))) + geom_col(aes(fill = job_category)) + geom_vline(xintercept = .5, linetype = "longdash", colour = "white", alpha = .4) + geom_vline(xintercept = .75, linetype = "longdash", colour = "white", alpha = .4) + scale_fill_manual(values = c( "Consultant" = "#1BD0D5FF", "Creative" = "#25ECA7FF", "Analyst" = "#62FC6BFF", "Other" = "#A2FC3CFF", "Specialist" = "#D2E935FF" )) + facet_wrap(~ industry_simple) + scale_x_continuous(labels = number_format(scale = 0.001, suffix = "k")) + labs(x = "Mean annual salary (USD)", y = "", title = "Mid-range jobs by industry") + theme(strip.background = element_rect(fill = "black"), strip.text = element_text(size = 8.5)) + guides(fill = "none")```<br>Directors in Education and Civil Society are most lowly-paid out of all industries. ```{r top-end}postings_clean |> filter(industry_simple != "Recruiting") |> group_by(job_category, industry_simple) |> summarise(n = n_distinct(job_id), salary = mean(normalized_salary, na.rm = TRUE)) |> filter(job_category %in% c("Manager", "Licensed Professional", "Engineer", "Director")) |> arrange(job_category) |> ggplot(aes(x = salary, y = fct_relevel(job_category, c("Manager", "Licensed Professional", "Engineer", "Director")))) + geom_col(aes(fill = job_category)) + geom_vline(xintercept = .5, linetype = "longdash", colour = "white", alpha = .4) + geom_vline(xintercept = .75, linetype = "longdash", colour = "white", alpha = .4) + scale_fill_manual(values = c( "Director" = "#30123BFF", "Engineer" = "#4147ADFF", "Licensed Professional" = "#4777EFFF", "Manager" = "#39A4FBFF" )) + facet_wrap(~ industry_simple) + scale_x_continuous(labels = number_format(scale = 0.001, suffix = "k")) + labs(x = "Mean annual salary (USD)", y = "", title = "Senior jobs by industry") + theme(strip.background = element_rect(fill = "black"), strip.text = element_text(size = 8.5)) + guides(fill = "none")```


